Trans Youth Graphs and Data
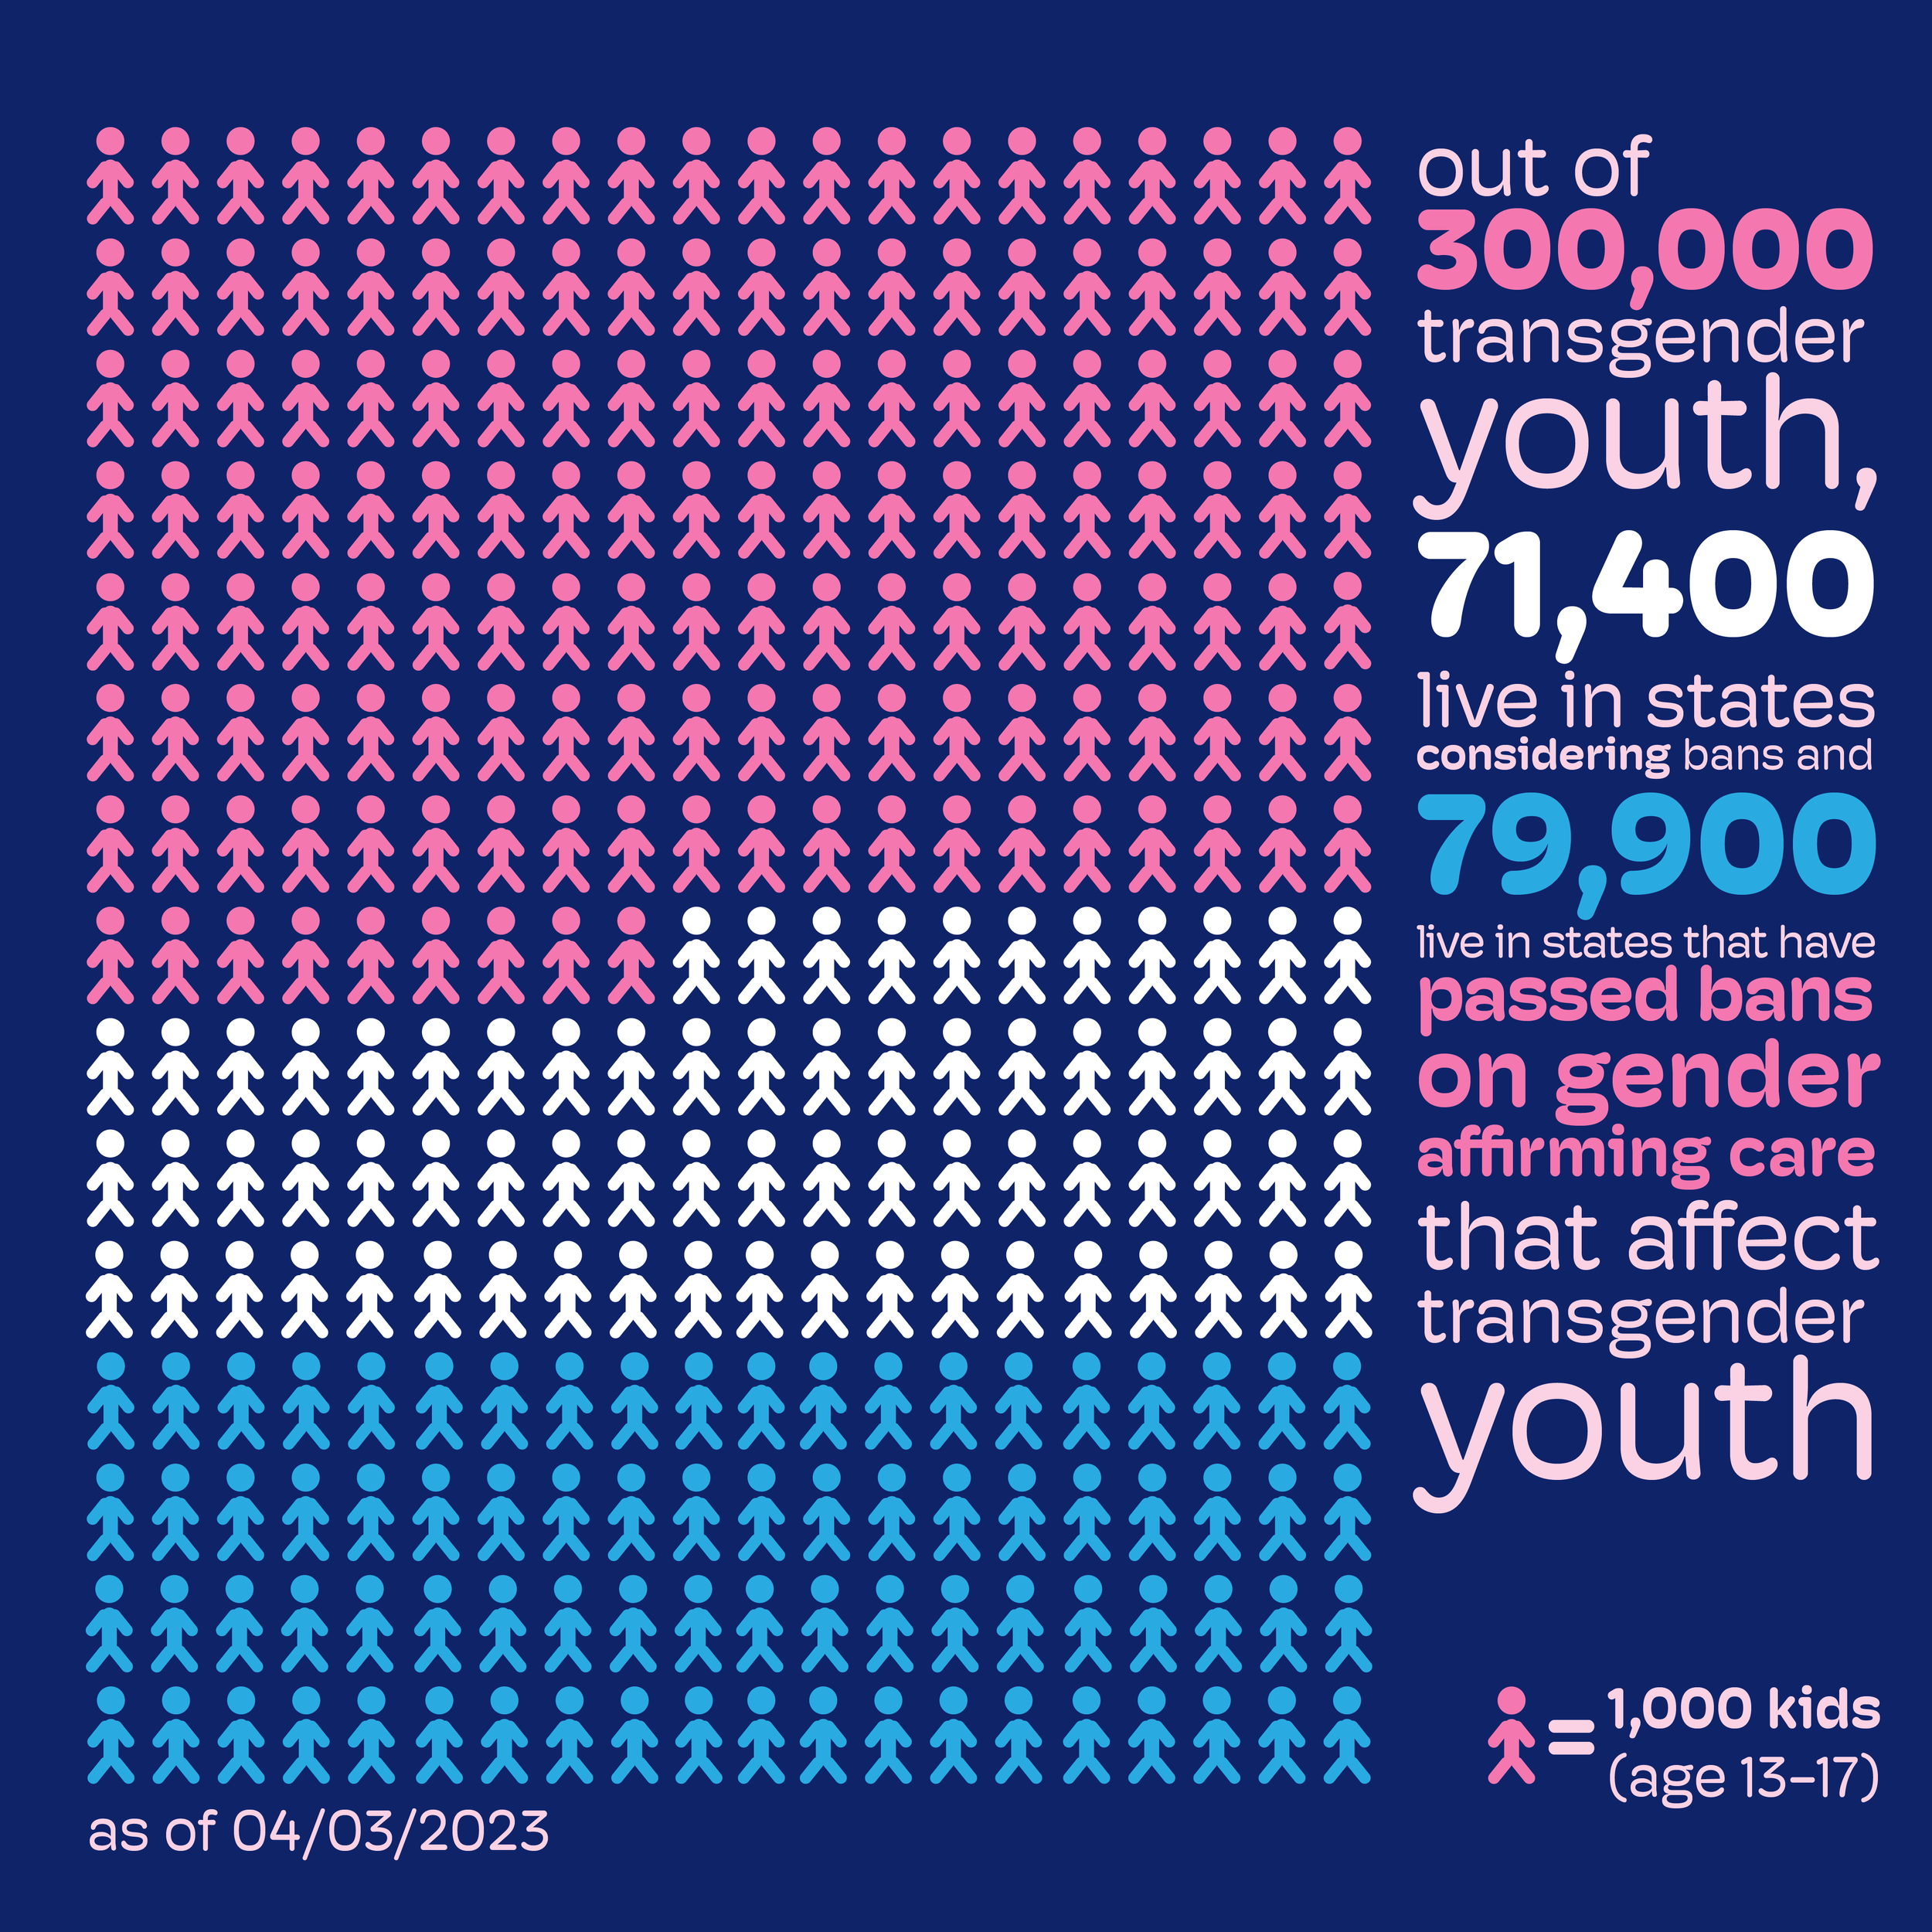
These graphs were designed to convey topical information in an easy to digest way.
During 2022 and 2023, anti-trans legislation has been surging, and the numbers reflected in this graphic change rapidly, so I felt it was important to include the dates of the information in the images as well.
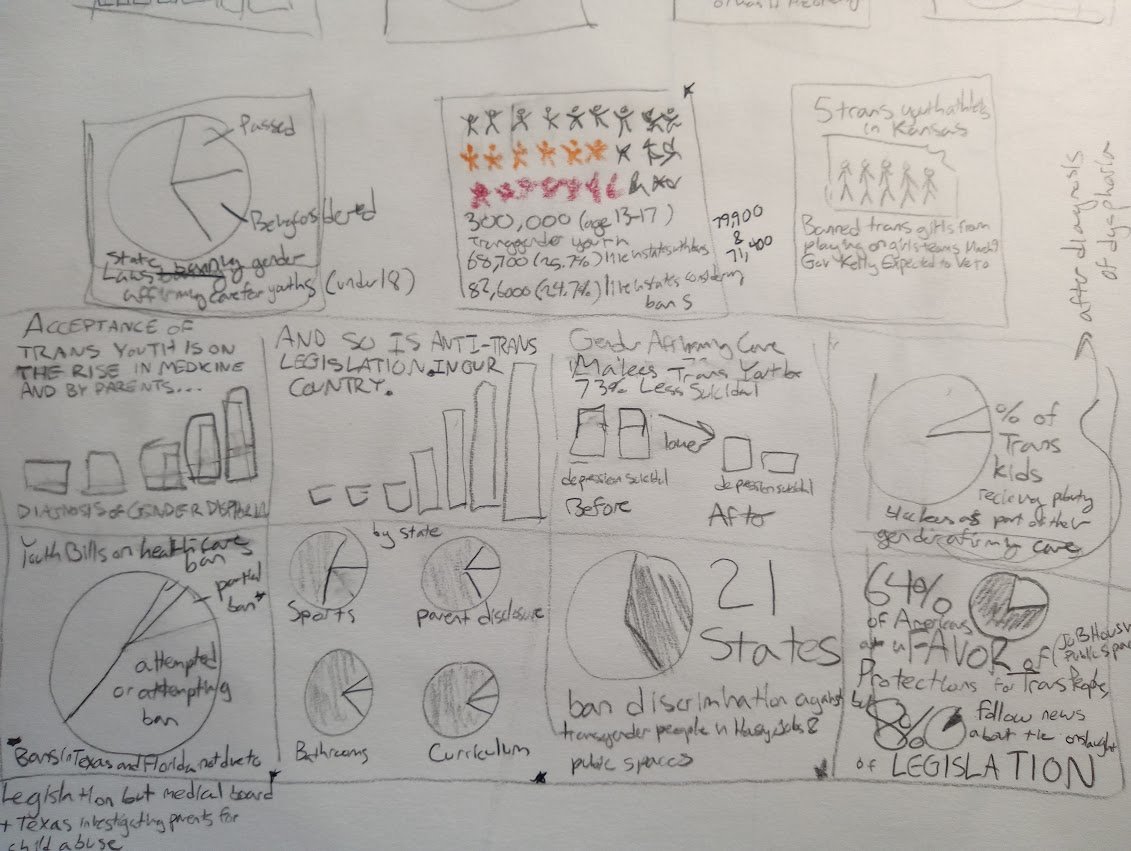
Process
The first step of this project was research. I checked the data sources like the Trans Legislation Tracker as a starting point, and checked multiple news articles before settling on the specific data I would use for this post. The Trans Legislation Tracker was my source for the number of billed introduced, passed, and failed. I relied on data from the Human Rights Campaign for the data on trans youth living in states that ban gender affirming care.
After brainstorming different layouts and potential concepts for the graphics, I settled on the specific data and imagery I wanted to focus on. I chose a pink, blue, and white palette inspired by the transgender flag.


